CRITICAL ALERT: P1 INCIDENT
[03:14:02 UTC] Agent "DataSync-Bot" executed 4,000 recursive database deletes.
Status: Disconnected.
Reasoning: Unknown.
When traditional software crashes, you get a stack trace. When an autonomous AI agent fails, you get silence—or catastrophic cascading actions based on a hallucinated prompt.
Why Traditional Logging Fails Agents
Traditional apps follow deterministic paths. Agents make non-deterministic decisions, requiring a fundamentally different approach to observability.
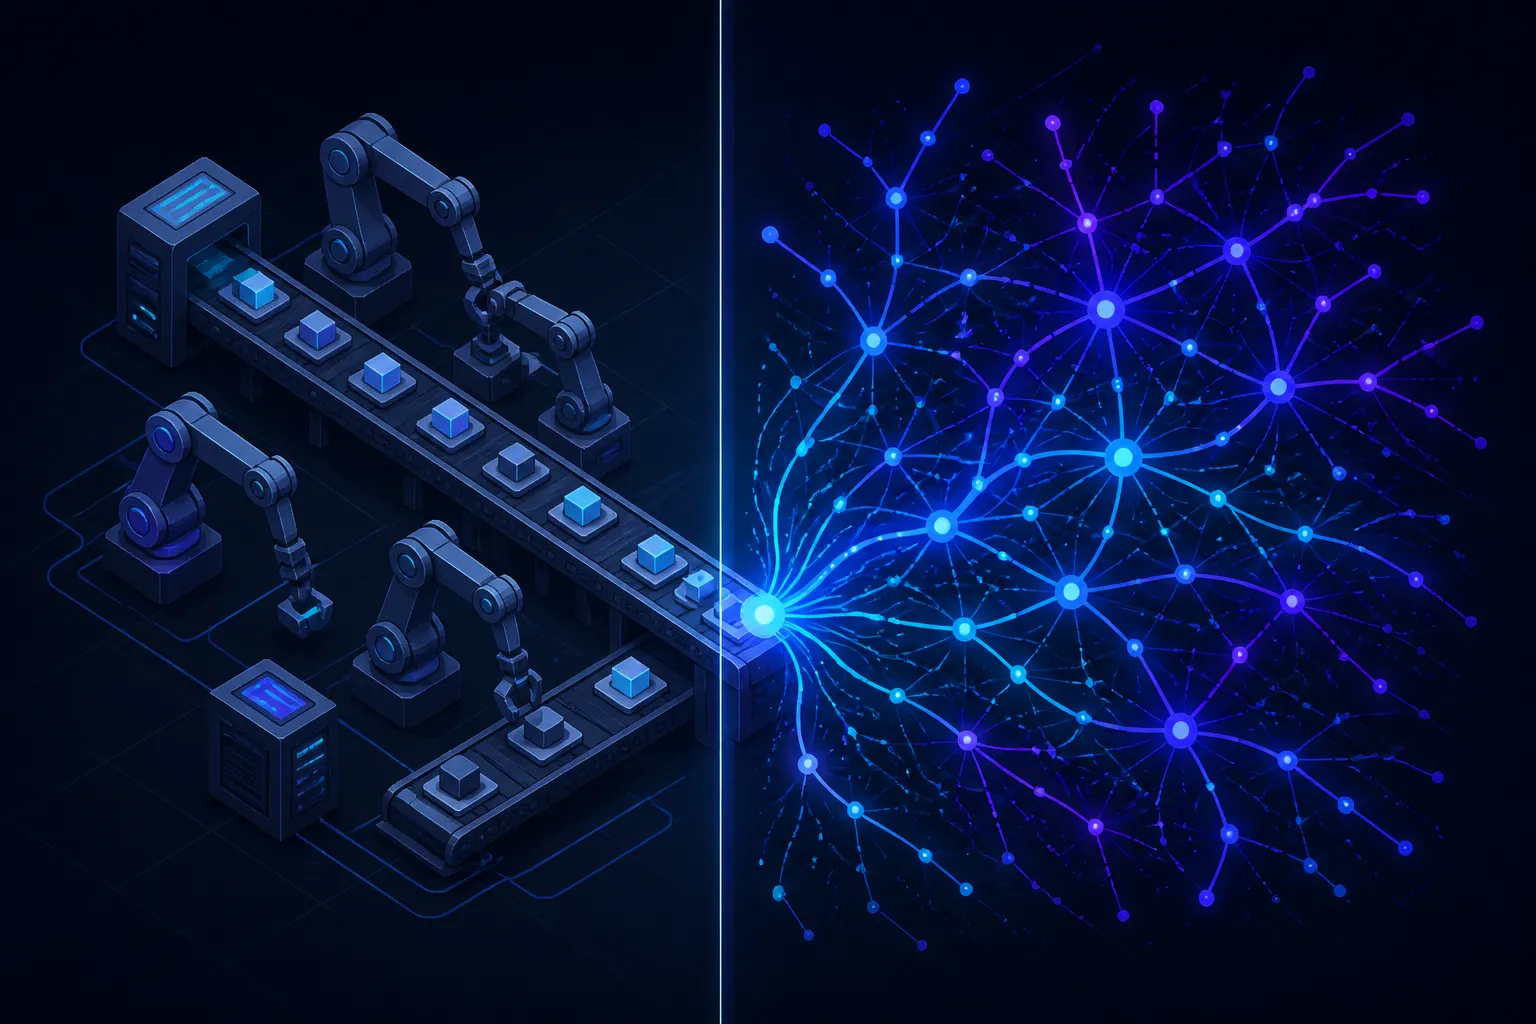
Drag across the box to compare (simulated via mouse movement)
What is Agent Telemetry?
Agent Telemetry is the continuous collection of an agent's internal state, reasoning trajectories, tool executions, and external communications.
Unlike standard application performance monitoring (APM) which tracks latency and error rates, agent observability tracks intent and context.
Without telemetry, an agent is a black box. If it deletes a file, you don't know if it did so because of a user prompt, a system prompt, or a hallucinated logic loop.
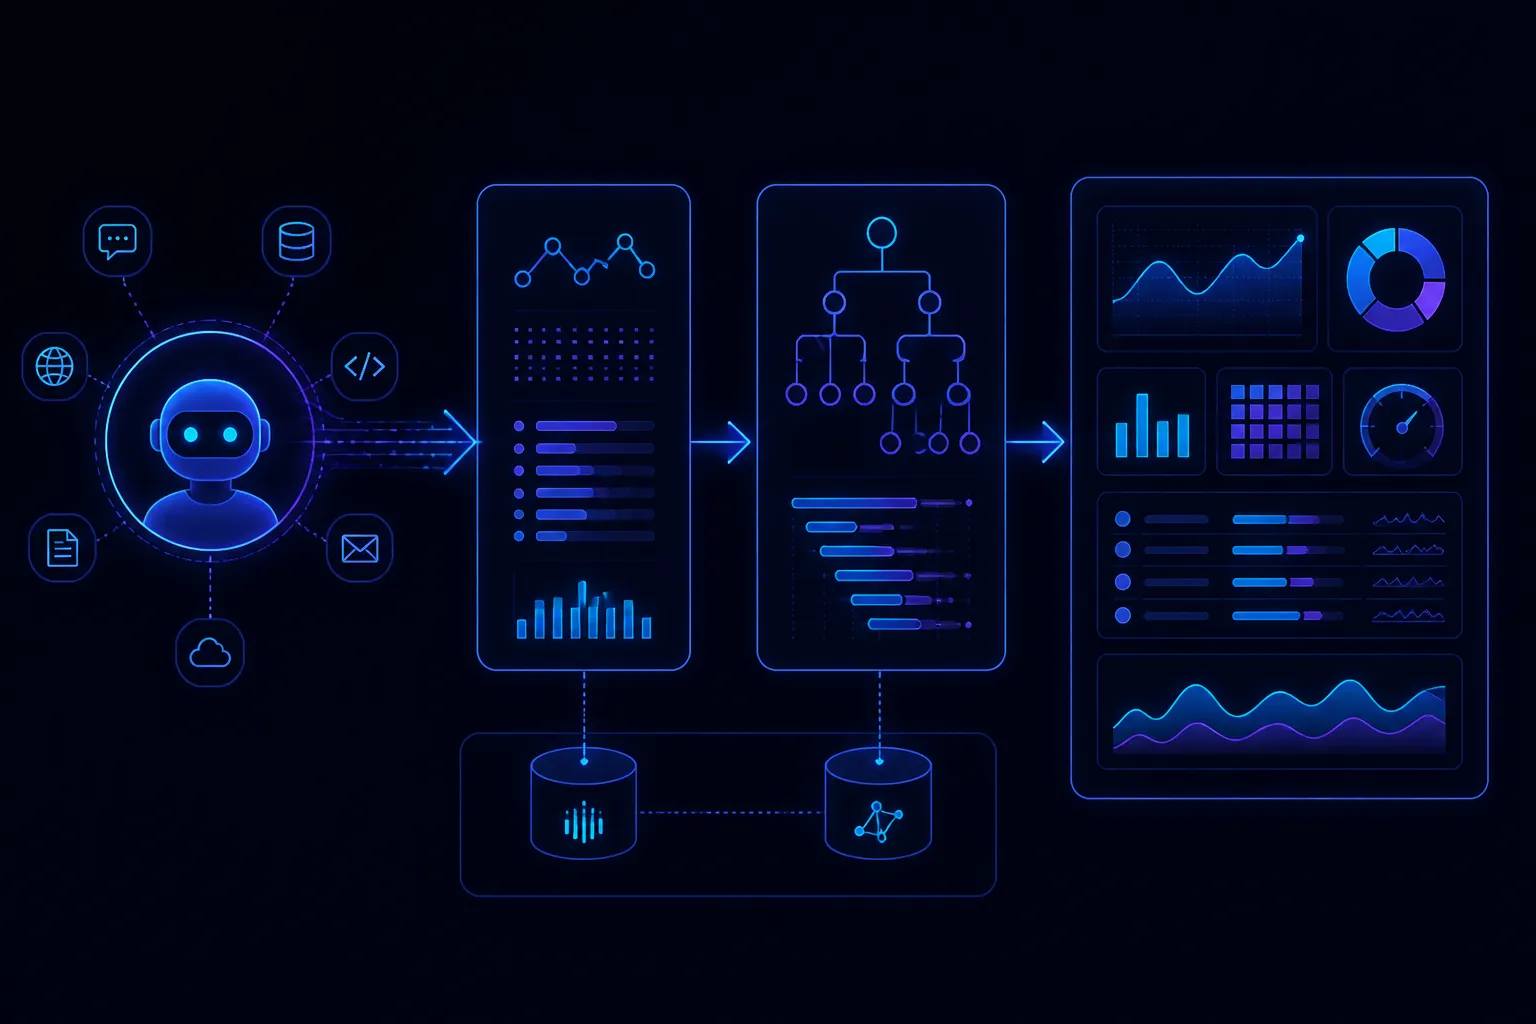
The Observability Pipeline
Click the hotpots to reveal how data flows from the agent to the debugging dashboard.
Knowledge Check: Concepts
Match the traditional software concept on the left to its Agent Observability equivalent on the right.
Trajectory Analysis
An execution trace (or trajectory) links every step of an agent's reasoning. Click to step through a typical trace.

User Prompt
User asks: "Summarize the Q3 financials and email them to Sarah."
LLM Generation (Thought)
Agent reasoning logged: "I need to query the financial DB for Q3, then use the email tool."
Tool Execution
Spans recorded: db_query({"quarter":"Q3"}) followed by send_email({"to":"sarah@...", "body":"..."})
Tool Call Diagnostics
Agents frequently fail because they hallucinate parameters or format tool calls incorrectly. Observability tools flag these schema mismatches.
Find the error in the raw tool call payload below. Click the mistaken parameter.
Knowledge Check: Diagnostics
Based on the previous page, why is it critical to capture the exact string the LLM generated for a tool call, rather than just the parsed JSON?
Click to reveal the answer
Because LLMs often generate invalid JSON (e.g., trailing commas, unescaped quotes). If you only log the parsing error, you lose the context of what the agent was actually trying to do. You need the raw string to debug the prompt instructions.
Context Window State Tracking
As an agent runs, its context window grows. Monitoring token consumption and context state is vital for preventing out-of-memory errors and context dilution.

Slide to simulate the agent progressing through a 10-step reasoning task.
Distributed Agent Observability
Modern architectures use Multi-Agent systems. A Supervisor agent delegates tasks to Worker agents. Tracking this requires Distributed Tracing (passing trace IDs between agents).
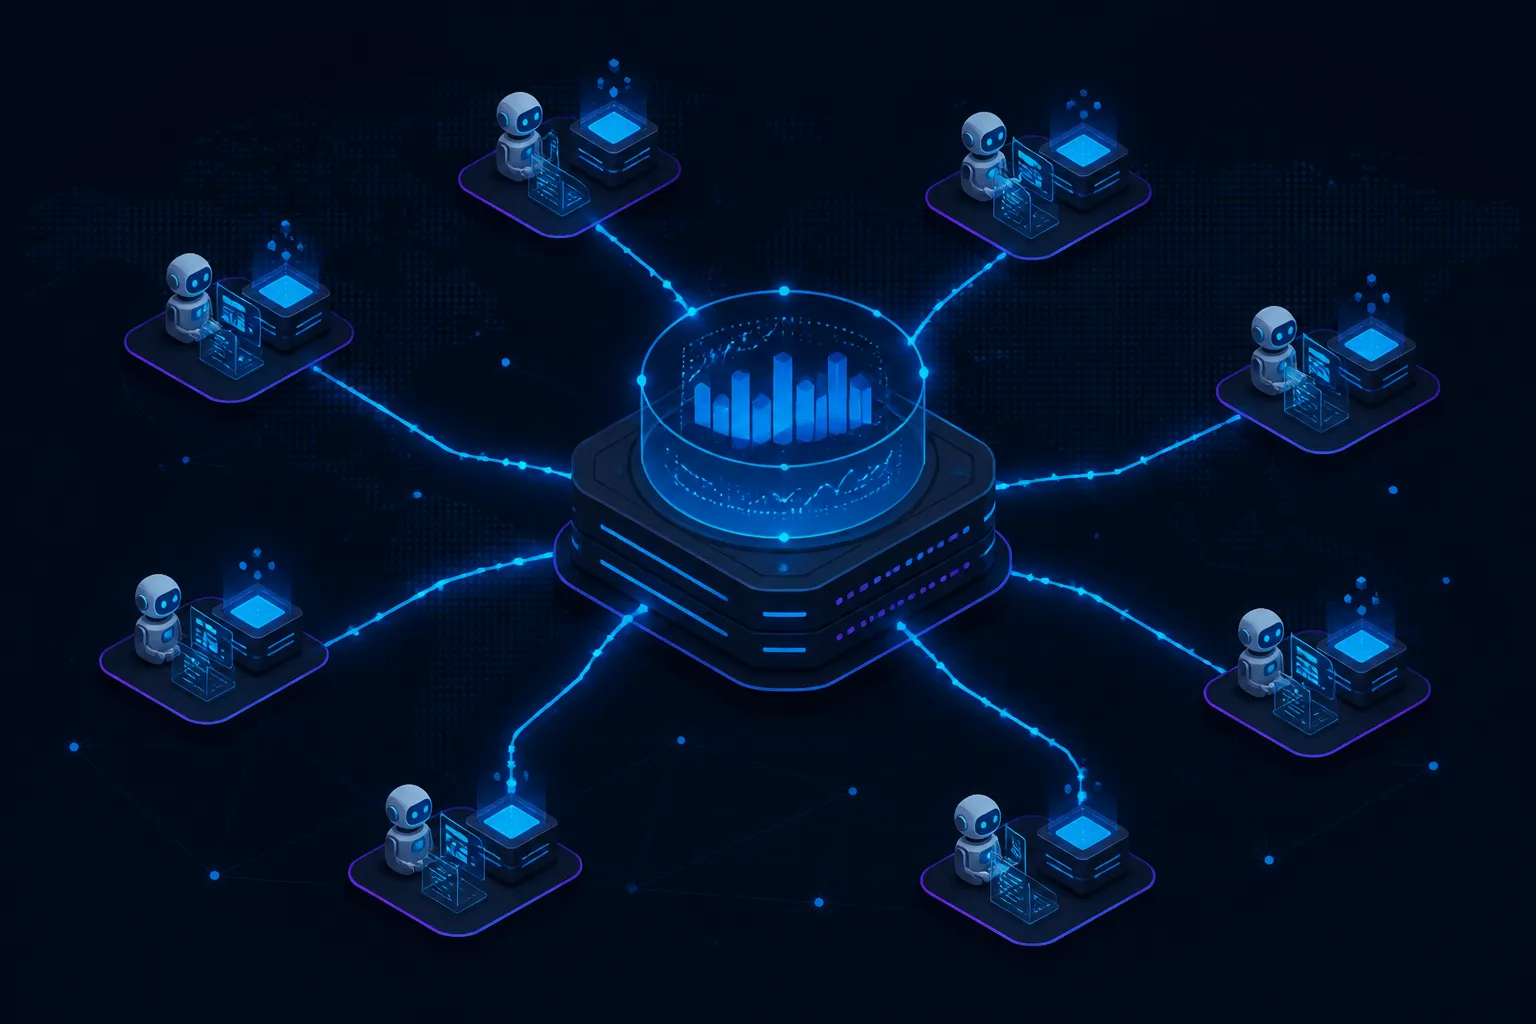
The challenge: When the "Researcher" agent fails, the "Writer" agent receives bad data, but the final output just looks like poor writing. Distributed tracing connects the Writer's failure back to the Researcher's tool error.
Knowledge Check: Pipeline Sequence
Drag the steps into the correct chronological order for an observability pipeline processing a tool call.
Production Debugging Workflows
Use the scrubber to walk through a typical incident response timeline.

1. Alert Triggered
APM triggers a PagerDuty alert: Agent error rate spiked to 15%. Metric: tool_call_failure_rate.
Key Takeaways
- Agent Telemetry captures intent, reasoning, and context, not just request latency.
- Execution Traces string together thoughts, actions, and observations into a debuggable trajectory.
- Raw Capture is vital: Logging raw LLM strings is essential for debugging tool schema hallucinations.
- Distributed Tracing connects multi-agent architectures using shared trace IDs.
You are now ready to implement observability in your autonomous systems.
Questions
Test your knowledge on Agent Observability & Tracing.
You need 80% to pass and earn your certificate.
Question 1
What is the primary difference between traditional application logging and agent telemetry?
Question 2
When analyzing an agent's execution trace, what is the most critical component for diagnosing tool call failures?
Question 3
How does state tracking in agent observability differ from standard web session tracking?
Question 4
What is the main benefit of workflow visualization in distributed agent architectures?
Question 5
During root cause analysis of a rogue agent loop, which observability feature is most useful?